FinLit Newsletter · 1 min read
FinLit Newsletter 10-6-2023
A week with a lot of jobs data still leaves uncertainty. Let's dig into the headlines
TLM Research
Published · Updated

A week with a lot of jobs data still leaves uncertainty
This was a big week for employment data, which will be coupled with price stability data as the two most important things to watch for the foreseeable future.
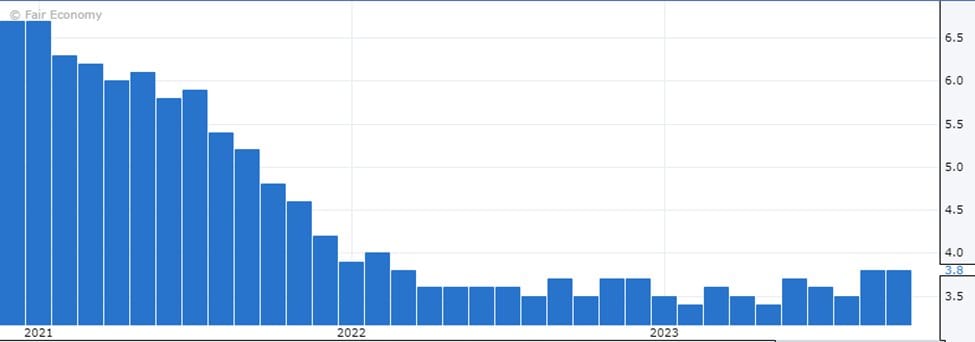
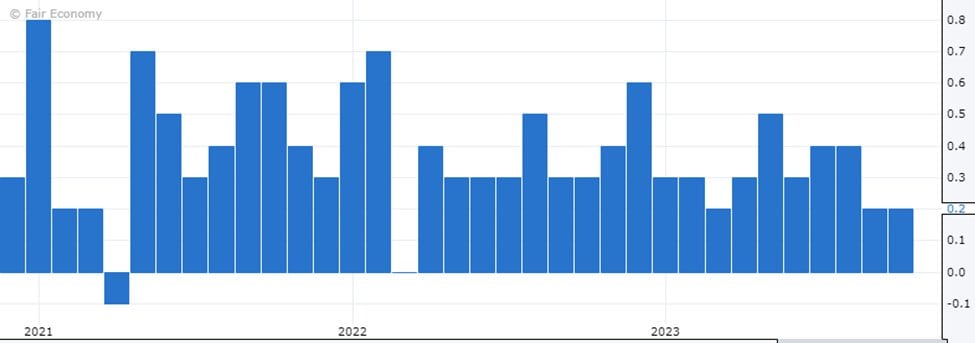
Here’s a summary of data released this week. Also, we’ll show them zoomed out from the start of 2021 so you can understand the bigger picture.
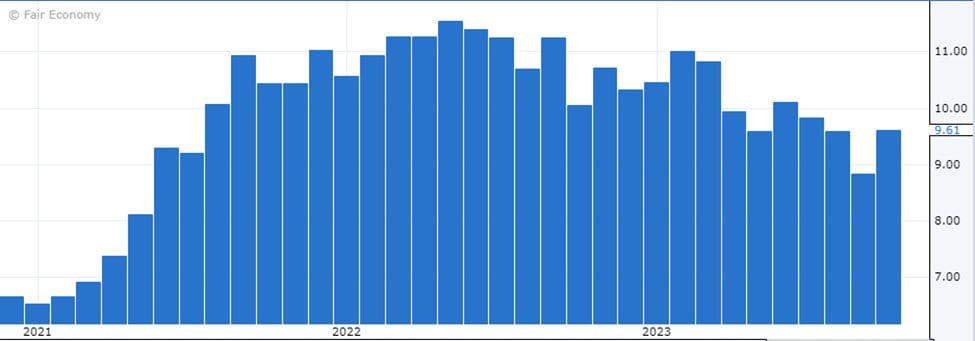
• Tuesday: JOLTS Job Openings up to 9.61m from 8.92m m/m
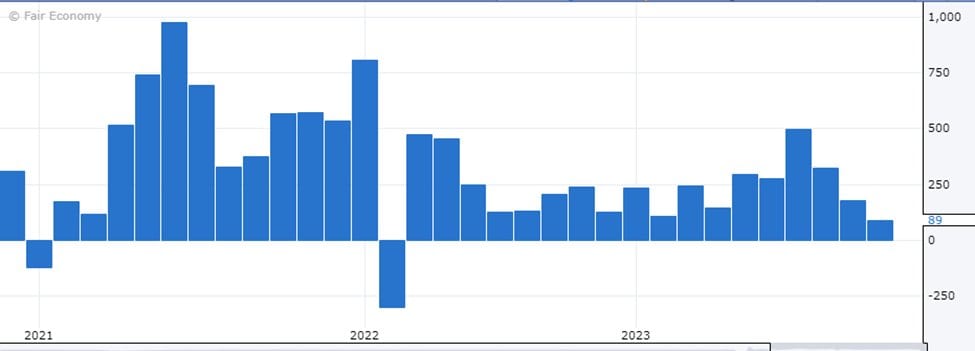
• Wednesday: ADP Non-Farm employment change up 89k m/m (excludes government jobs)
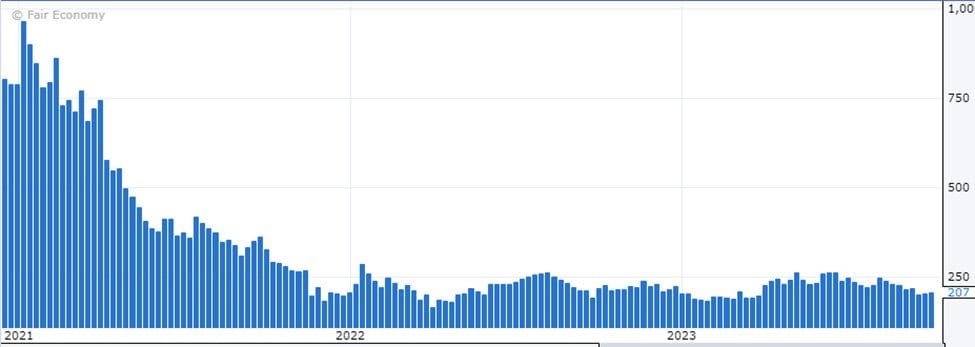
• Thursday: Unemployment claims up to 207k from 205k week over week
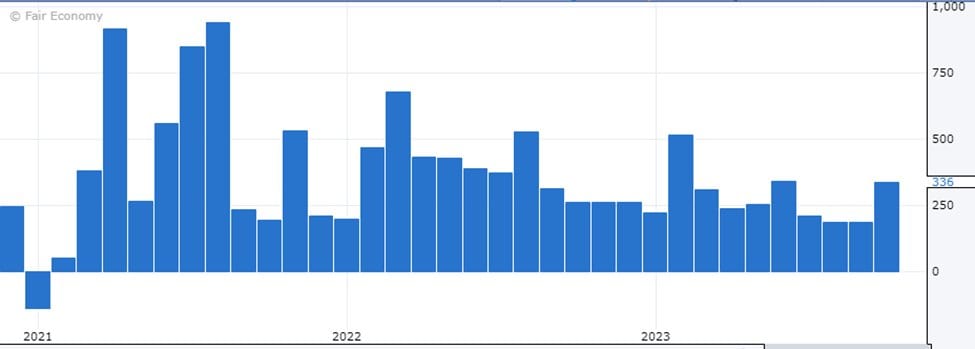
• Today: BLS Non-Farm Employment Change up 336k m/m (includes government jobs)
• Today: Unemployment Rate unchanged
• Today: Wage Growth up 0.2% m/m, or 4.2% y/y
These are the types of data that the Fed is speaking about when Powell says (often) that they look at the “totality” of the data. Despite highly questionable underlying fundamentals, it’s not quite clear that the labor market has completely turned over yet, though depending on where you look you can find some cracks.
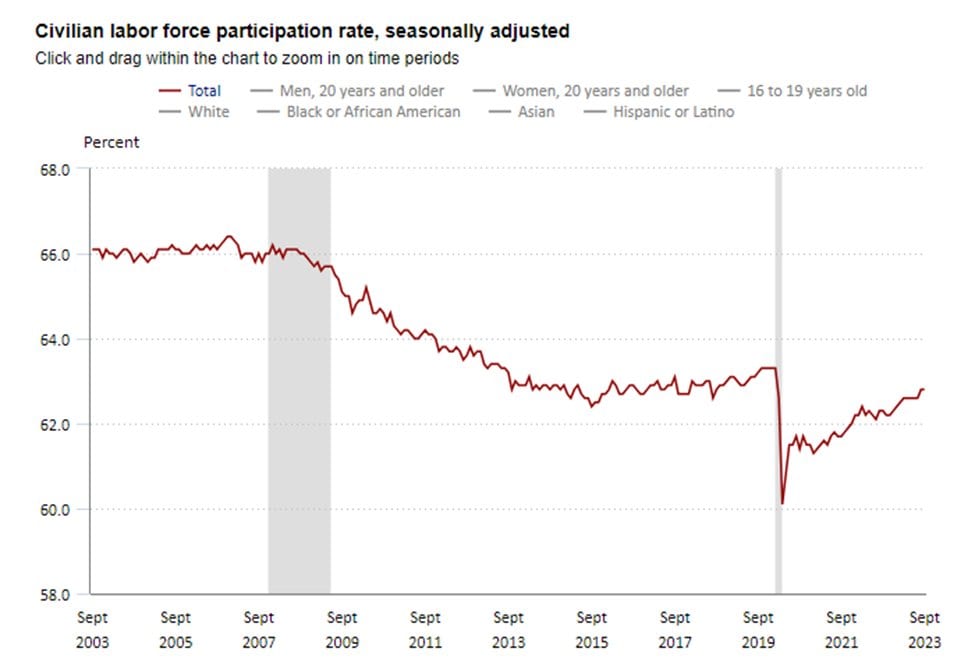
Another interesting bit to highlight from a macro level is that labor force participation is just now approaching pre-Covid levels, with participation being suppressed first due to lockdowns, then due to fiscal stimulus packages, then further by excess savings amassed during Covid. Now that Covid household savings have virtually all dried up, it makes sense that more and more people are trying to return to work. With participation rates normalizing, data like unemployment rate will be more “apples-to-apples” against pre-Covid data.
The labor market’s relative resilience is also going to provide downward pressure on stocks, as it gives the Fed much more runway to focus on price stability by raising rates and supporting an overall more aggressive monetary policy.
Included with membership — $49/mo.
Keep reading

FinLit Newsletter 10-3-2023
10-year US Treasury yield reaches its highest level in 16 years – intro to some bond market basics
TLM Research

FinLit Newsletter 9-29-2023
PCE index cools slightly today – today is about understanding how to deal with economic and financial data
TLM Research

FinLit Newsletter 9-27-2023
Mortgage demand shrinking while mortgage rates hit 23-year high – Let’s talk about housing, stimulus, and consequences
TLM Research