FinLit Newsletter · 3 min read
FinLit Newsletter 9-19-2023
How do we “look under the hood”? Let's dive into U.S. spending, debt, and the current state of the consumer (i.e. you)
TLM Research
Published · Updated
How do we “look under the hood”? Spending, debt, and the current state of the consumer
Our goal is to look beyond the headline numbers to understand how the economy actually works, and this week provided a textbook example of what we mean.
On Monday, in a CBNC interview, Treasury Secretary Janet Yellen that she doesn’t “see any signs that the economy is at risk of a downturn” and describe the current economic situation as “the best of all worlds to see continued strength in the economy, a good strong labor market, and inflation moving down.”
So, what is she referring to? While there are an indefinite number of metrics out there, here are probably a few that she has in mind with a statement like this:
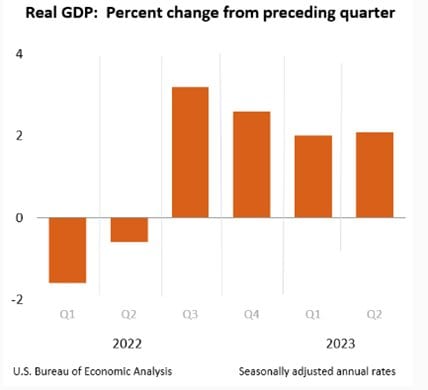
“Continued strength in the economy” – GDP has been growing for several quarters at a healthy rate (over 2.0% is considered healthy for an economy for the US)
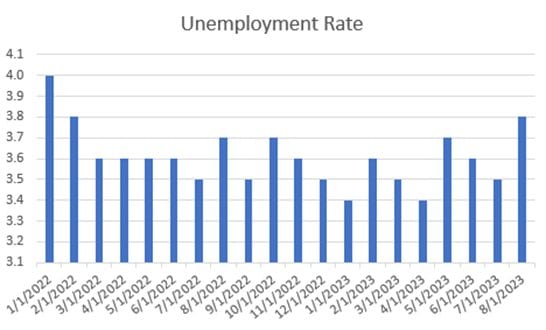
“A good strong labor market” – The unemployment rate is still under 4% which would be considered a “tight” labor market.
“Inflation is moving down” – Headline CPI is moving down from last year’s highs
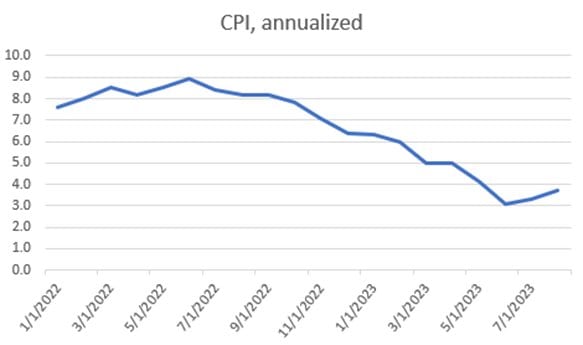
Pairing the narrative with the data already raises a few questions. One that sticks out is, unemployment and CPI are slightly nudged upward as of their most recent readings, so it’s clear Yellen is talking about CPI as a long-term trend and unemployment in relation to a certain threshold, not as a trend, but we only have one recent reading to go off which is not enough to determine that the current trend has changed, so we’ll wait and see there.
Diving beyond the headline data
We keep using the phrase “headline data”. The simple fact is that certain data points drive decision making more than others for policymakers. These are the data releases that make the front page of the Wall St. Journal or CNBC, hence, headlines. These are the data that Yellen is quoting. Now let’s look beyond the headline data.
The thing that concerns us first and foremost right now is consumer debt. It’s difficult enough to manage constant levels of debt with interest rates more than doubling, but we have a scenario where interest rates have more than doubled while debt balances are also increasing. Look at the trend below, and specifically, note that credit card debt for consumers is starting to balloon. These types of debt balances are the most dangerous, as they are unsecured and have extremely high interest rates
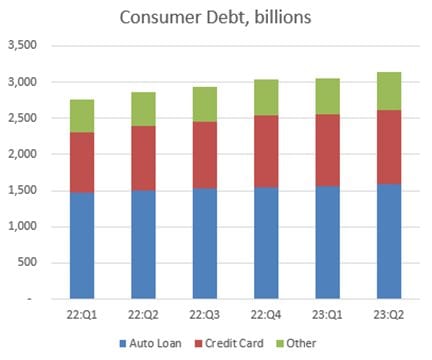
The reason it’s important to look at debt when we discuss the health of an economy is because spending can come from multiple sources. It can come from wages earned, in other words, you get a paycheck, you go spend it, that’s good for everyone. But it can also come from debt – you use a credit card, you spend money to buy things, that’s good for the merchant but you as the consumer have not used the value of your paycheck in that transaction. Instead, you’ve indebted yourself. That is very, very bad unless your wages are growing at a commensurate rate to support this. So let’s take a look at wages.
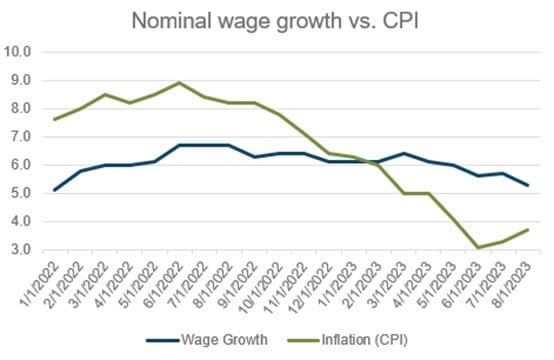
In 2022, workers enjoyed a robust spike in wages, though, the price of everything went up, as you can see in the below chart. But now late in 2023, we’re seeing that wage growth is clearly cooling off, while inflation may be remaining sticky or even popping up.
When adjusted for inflation, current real wage growth is roughly 1.6%. This is the actual wage growth that is being taken home by workers after accounting for inflation.
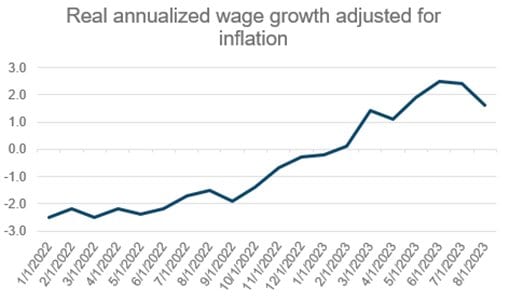
So now think of it this way: real wage growth after inflation is up roughly 1.6% year over year, while credit card balances are up 16% year over year. When you think of it like this, it paints a different picture of where spending is coming from and how healthy the economy is.
Included with membership — $49/mo.
Keep reading
FinLit Newsletter 9-14-2023
Back-to-back readings of hotter inflation in US this week, we’re starting with the basics. Learn what CPI & PPI are today.
TLM Research
FinLit Newsletter 9-21-2023
How does a central bank actually work? This is something you need to know! Let's dive in.
TLM Research
FinLit Newsletter 9-12-2023
Is global divergence beginning to show, or are the first dominoes getting to fall? Let's talk macro-economics.
TLM Research